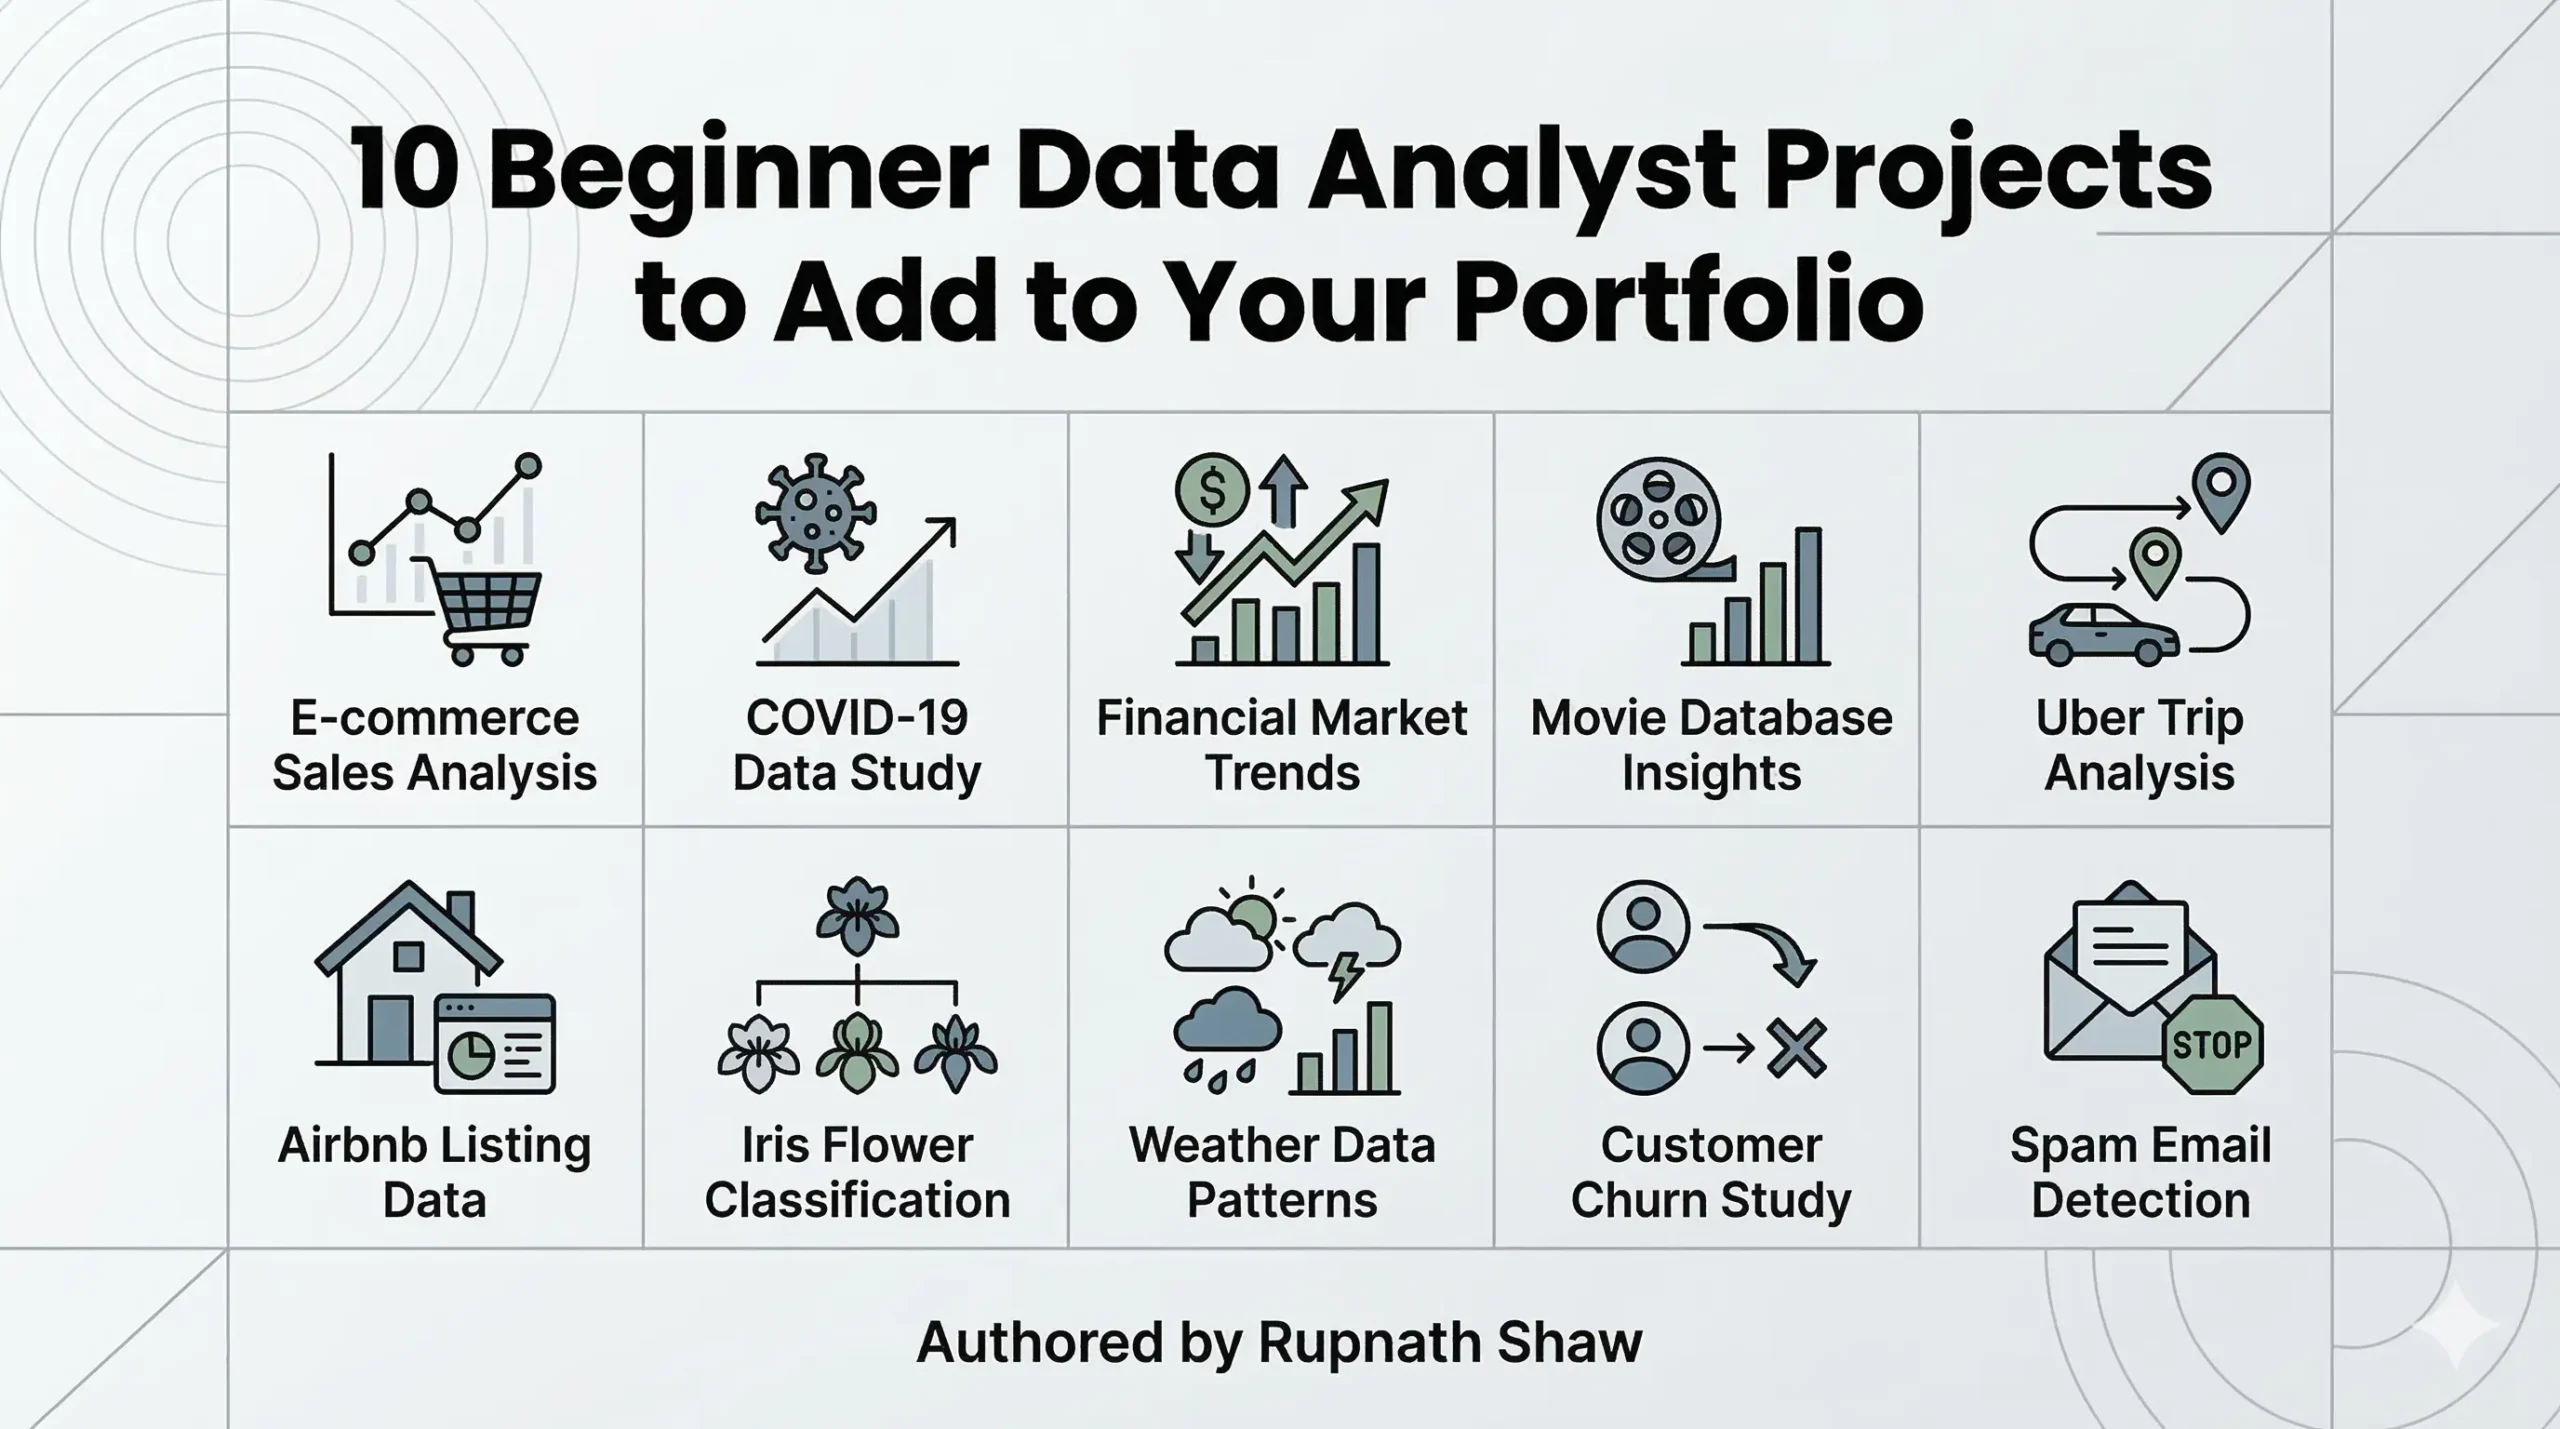
Your resume says you know SQL and Python. These projects prove it.
Most data analyst job descriptions ask for a portfolio. Most beginner portfolios have the same three things: a Titanic survival analysis, an IPL dataset, and a project titled ‘Sales Dashboard’ with no context. Recruiters see hundreds of these.
The projects in this list are chosen specifically because they are beginner-friendly, built on freely available data, and cover different skill areas – SQL, Python, visualization, storytelling, and end-to-end analysis. Done properly, any one of them demonstrates more than a generic tutorial project copied from YouTube.
Each project has the tools you need. It shows where to get the data. Most importantly, it explains what it proves to anyone looking at your portfolio. That last part matters. A project that nobody can interpret is a project that does not help you.
The list is split into three levels. Start at Level 1 if you are brand new. Move to Level 2 once you can clean and explore data comfortably. Tackle Level 3 when you want something that looks serious on a portfolio.
Level 1: Getting Started — Pure Exploration and Visualization
These projects are entry points. They need little coding. They help you get comfortable with data. You’ll ask questions and build your first charts and dashboards. Do not skip them because they feel simple. Done with real insight and clean presentation, they are perfectly acceptable portfolio pieces.
-
E-Commerce Sales Analysis
This dataset has order data, customer locations, product categories, reviews, and delivery times across 100,000 transactions. A beginner can build a clean analysis asking: Which product categories sell most? Which states have the highest order volume? How does delivery time affect review scores? The dataset is messy enough to be realistic and rich enough to find something interesting.
- Tools: Python (pandas, matplotlib), Excel, or Power BI
- Dataset: Kaggle: Brazilian E-Commerce dataset (Olist) – free download, well-documented
- Proves to a recruiter: You can clean real data, spot trends, and turn numbers into a story about customer behaviour
-
COVID-19 Data Dashboard
Everyone knows the topic but very few beginner portfolios actually build a clean dashboard from it. Track cases, deaths, and vaccination rates across three to five countries over time. The key point isn’t the data itself — it’s the design choices. This includes which countries to compare, what time frame tells a clear story, and how to label the chart. These choices help everyone understand it without needing an explanation.
- Tools: Python (pandas, plotly) or Power BI or Tableau
- Dataset: Our World in Data (ourworldindata.org) – free, updated, well-structured CSV
- Proves to a recruiter: You can work with time series data, handle date columns, and build a multi-metric dashboard
-
Superstore Sales Performance Report
The Superstore dataset is a great starter for BI tools. It has key dimensions like region, category, customer segment, and ship mode. Plus, it includes important metrics such as sales, profit, discount, and quantity. This mix lets you create interesting analyses. Build a dashboard that answers a specific business question rather than just putting every chart you know onto one screen.
- Tools: Tableau Public (free) or Power BI Desktop
- Dataset: Tableau’s Superstore dataset – built into Tableau Public, also downloadable as CSV
- Proves to a recruiter: You know how to build an interactive dashboard with filters, slicers, and drill-down views
-
Movie Ratings Exploratory Analysis
This is a comfortable dataset to learn EDA on because everyone has an intuition about movies. Are higher-budget films rated better? Do ratings vary by genre? Which directors average the highest scores? The key isn’t the answers. It’s about asking questions, exploring them step by step, and showing your results in a notebook.
- Tools: Python (pandas, seaborn, matplotlib)
- Dataset: IMDb dataset or MovieLens dataset – both free on Kaggle
- Proves to a recruiter: You can ask good questions from data, explore distributions, and spot correlations
Level 2: Building Depth — SQL, Cleaning, and End-to-End Analysis
You need to write SQL, manage messy data, or create an analysis. This analysis should turn raw data into clear business recommendations. They take longer and look significantly better in a portfolio.
-
Retail Customer Segmentation Using RFM Analysis
RFM means Recency, Frequency, and Monetary value. These three metrics help in marketing analytics to segment customers. You check when each customer last purchased, how often they buy, and how much they spend. Then, you score and group them. It’s not technically complex, but it shows you grasp how analysts view real business problems. It’s more than just knowing how to run a groupby.
- Tools: Python (pandas, matplotlib, seaborn) or SQL + Excel
- Dataset: UCI Machine Learning Repository: Online Retail Dataset (UK e-commerce transactions)
- Proves to a recruiter: You understand business metrics, can build derived features, and know how to group customers by behaviour
-
SQL-Based HR Analytics
Build this entirely in SQL. Find attrition rates by department, by job role, by age group. Rank departments by average monthly income. Identify which job satisfaction scores correlate with higher turnover. Document your queries in a GitHub repository with clear comments. This project is great if you want analyst roles in BFSI, consulting, or big companies with HR analytics.
- Tools: SQL (MySQL, PostgreSQL, or SQLite), optional: Power BI for final dashboard
- Dataset: Kaggle: IBM HR Analytics Employee Attrition dataset – free, clean, well-structured
- Proves to a recruiter: You can write multi-table SQL queries, use aggregations and window functions, and draw insights from structured data
-
IPL Player Performance Analysis (With a Twist)
The IPL dataset is overused, but most people use it badly – they just plot run totals and win counts. The twist that makes this stand out: pick a specific analytical question that requires more than one step. Which batsmen perform better under pressure (death overs, chasing targets)? Which bowlers are most economical specifically in the powerplay? Frame it as an analyst would – with a hypothesis, an approach, and a recommendation.
- Tools: Python (pandas, matplotlib) or SQL
- Dataset: Kaggle: IPL dataset with ball-by-ball data from 2008 to 2024
- Proves to a recruiter: You can handle large datasets, write multi-step analyses, and build conclusions beyond surface-level stats
-
Zomato Restaurant Data Analysis
This dataset has restaurant names, cuisines, cost for two, ratings, location coordinates, and online ordering availability. Useful questions: Which cuisines have the best average ratings? Is there a relationship between cost and rating? Which areas of a city are underserved by certain food types? Include a map visual when using Python with folium. Geographic visuals really make your portfolio stand out.
- Tools: Python (pandas, seaborn, folium for maps) or Power BI
- Dataset: Kaggle: Zomato Restaurant Dataset (multiple cities available)
- Proves to a recruiter: You can work with categorical and geographic data, clean real-world inconsistencies, and build location-based insights
Level 3: Portfolio-Ready — End-to-End Projects With a Business Story
These projects require more time and more thought. They go from raw data to a clean final output with a clear business recommendation attached. These are the projects you talk about in interviews when someone asks you to walk them through your work.
-
Financial Loan Default Risk Analysis
Loan default analysis is a standard use case in BFSI analytics. The dataset has demographic, financial, and credit history variables.
Your job isn’t to build a model. Instead, focus on these tasks:
-
Identify which variables are most linked to default risk.
-
Rigorously clean and validate the data.
-
Present a clear summary of your findings, using visuals for support.
Structure it as a report: problem statement, approach, findings, recommendation. That structure alone sets it apart from 80% of beginner portfolios.
- Tools: Python (pandas, matplotlib, seaborn) + SQL for data preparation
- Dataset: Kaggle: Home Credit Default Risk dataset or LendingClub loan dataset
- Proves to a recruiter: You can handle a large, complex dataset, identify risk patterns, and frame findings as a business recommendation
-
End-to-End Sales Dashboard With Data Story
This is the capstone of a beginner portfolio.
-
Take a messy dataset and clean it using Python. Document your steps clearly.
-
Build a dashboard in Power BI or Tableau. Make sure it answers three to five specific business questions.
-
Publish your dashboard on Tableau Public or share the Power BI link.
-
Write two paragraphs about your findings and recommendations.
That description sets an analyst apart from someone who merely uses the tools.
- Tools: Python for data cleaning + Power BI or Tableau for dashboard, hosted publicly
- Dataset: Use any real or synthetic sales dataset. Kaggle offers many retail and B2B sales options.
Shows a recruiter: You can turn raw data into a clear, shareable dashboard and explain its meaning.
Wrapping Up
Ten projects is not a target – it is a menu. Choose three to four items. Do them well. Document each one clearly so anyone can understand without your explanation.
-
Level 1: E-Commerce Sales Analysis, COVID Dashboard, Superstore Report, Movie Ratings EDA
-
Level 2: RFM Segmentation, SQL HR Analytics, IPL Analysis (with a focused angle), Zomato Analysis
-
Level 3: Loan Default Risk Analysis, End-to-End Sales Dashboard with data story
One well-documented project on GitHub beats five half-finished ones. Write a README for each project that explains the problem, your approach, and what you found. That is what a recruiter opens when they click the link on your resume.
Read Also:
Best Power BI Certifications and Training for Beginners in 2026
Step-by-Step Guide to Crack the Cognizant Analyst Trainee Interview in 2026
15 Data Analyst Skills You Must Learn to Get Hired in 2026
Job Notification Join us on Telegram: Click here
Job Notification Join us on WhatsApp: Click here