Your data is scattered across five sources. ADF is the pipeline that pulls it all together here’s how to build one from scratch.
Every data analyst hits this wall eventually. The data you need is in five different places: a SQL database, an Excel file on SharePoint, a REST API, an FTP server, and a cloud storage bucket. You could move it manually. Plenty of analysts do for a while. But manual data movement isn’t scalable, it isn’t auditable, and it’s not the work that gets you promoted or hired. Azure Data Factory is what replaces it.
Azure Data Factory (ADF) is Microsoft’s cloud-based data orchestration and ETL service. It builds automated pipelines that move, transform, and load data between hundreds of sources without requiring you to manage a single server. You define the logic ADF handles the infrastructure.
A simple analogy: if Azure Synapse is the water tank holding your processed data and Power BI is the tap your users drink from, Azure Data Factory is the piping system connecting everything in between. Nothing flows without it.
ADF appears in over 70% of Azure data engineer job postings on Naukri.com and LinkedIn India. It’s not optional knowledge for cloud analytics roles it’s expected. This guide covers the core concepts, a full step-by-step pipeline build you can run on a free Azure account for under ₹20, a comparison with SSIS for analysts coming from SQL Server backgrounds, and a portfolio project worth putting on your resume.
One 2026 note worth flagging: ADF is being integrated into Microsoft Fabric as ‘Data Factory in Fabric’. The concepts are identical. Learning ADF now means your skills transfer directly same pipelines, same activities, updated interface.
1. ADF Core Concepts — Seven Terms That Unlock Everything Else
ADF has a specific vocabulary. Get these seven terms right and the rest of the platform clicks into place. Misunderstand one and you’ll spend an hour debugging a problem that was never where you thought it was.
| Concept | What It Is | Real-World Analogy |
| Pipeline | A container for activities that together perform a task | A recipe a sequence of steps with a defined outcome |
| Activity | A single step inside a pipeline (Copy, Transform, Run Notebook) | One action in the recipe. e.g. ‘chop onions’ |
| Dataset | A named pointer to data at a source or destination | The ingredient list what data you’re working with |
| Linked Service | Secure connection to a data source, stored with credentials | The pantry key how you access the ingredient store |
| Integration Runtime | The compute engine that executes your pipeline | The kitchen where the actual cooking happens |
| Trigger | What starts the pipeline (schedule, event, or window) | The alarm clock tells the kitchen when to start |
| Mapping Data Flow | Visual no-code transformation canvas inside ADF | The sous chef handles reshaping without writing code |
The relationship between these concepts is linear: a Trigger fires a Pipeline, which runs Activities against Datasets, using Linked Services as credentials, executed by an Integration Runtime. When a pipeline fails, your investigation always starts at the Integration Runtime it’s where the actual compute lived and where error logs originate.
The Mapping Data Flow is the concept most analysts underestimate. It’s a visual, no-code transformation interface that generates Spark code in the background. You don’t write a line of Python. You drag transformation nodes onto a canvas joins, filters, aggregations, column derivations and ADF compiles it to distributed Spark automatically. For analysts without an engineering background, this is the capability that makes ADF genuinely usable for complex data preparation.
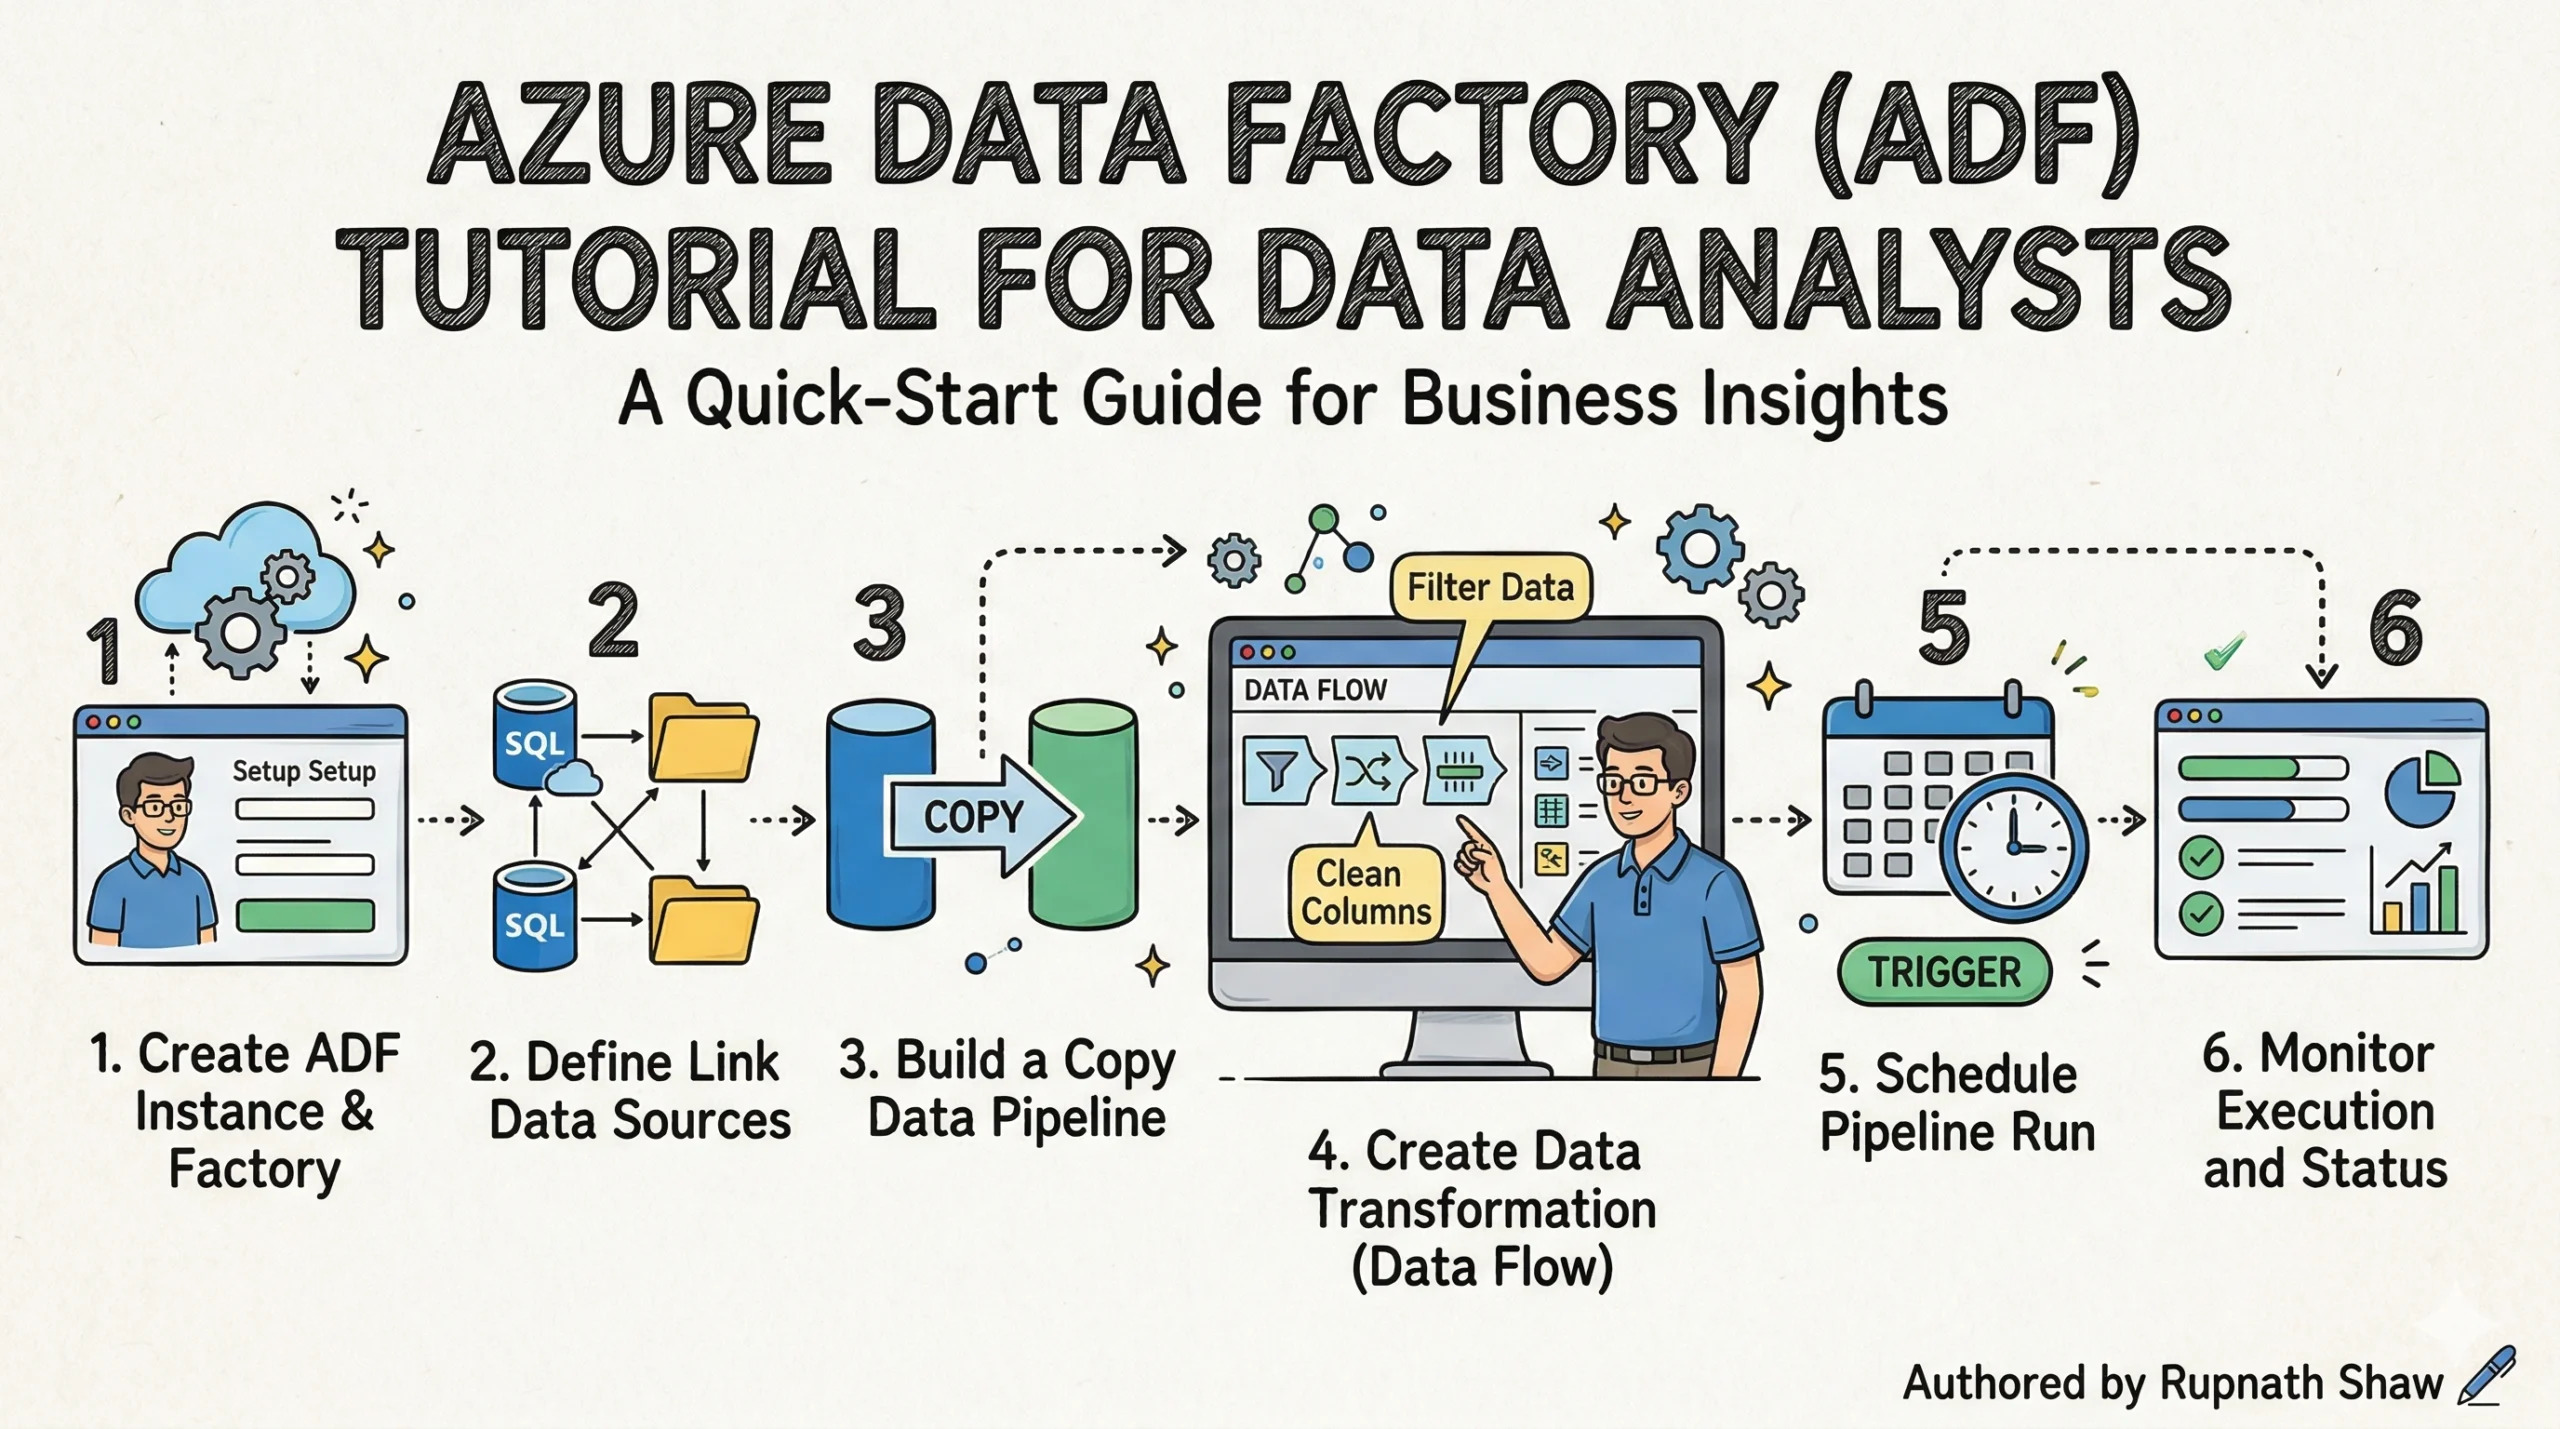
2. Hands-On — Build Your First ADF ETL Pipeline
Scenario: sales data arrives daily as a CSV file in Azure Blob Storage. You need to copy it, remove rows with null values, rename columns to match your reporting schema, and load the clean data into an Azure SQL Database where Power BI can query it. This is the most common real-world ADF use case, and it runs on a free Azure account for less than ₹20 in compute.
Environment setup (do this first):
- Create a Resource Group — portal.azure.com > Resource Groups > Create. Name it: adf-learning-rg. Region: choose one close to you.
- Create a Storage Account — search ‘Storage Accounts’, create one in the same resource group. Standard tier, LRS redundancy.
- Create an Azure SQL Database — search ‘SQL Databases’, create a new server alongside it. Use the free serverless tier (auto-pause after 1 hour idle). Create a table called SalesClean with columns: OrderID, ProductCategory, Region, SalesAmount, OrderDate.
- Create an Azure Data Factory instance — search ‘Data Factory’, create in the same resource group. Select the region closest to your storage account.
- Upload sample data — download any small sales CSV (AdventureWorks or a Kaggle sales dataset). Upload it to a container called raw-data in your storage account.
Step 1 — Create Linked Services (your connections):
- Open ADF Studio (click ‘Launch Studio’ from your ADF resource). Go to Manage > Linked Services > New.
- Add Linked Service 1: Azure Blob Storage. Select your storage account. Test connection — confirm it succeeds.
- Add Linked Service 2: Azure SQL Database. Enter your server name, database name, and credentials. Test connection.
Step 2 — Create Datasets (pointers to your data):
- Dataset 1 (source): New > Azure Blob Storage > DelimitedText. Name it DS_SalesCSV. Point it to your raw-data container and CSV file. Set ‘First row as header’ to true.
- Dataset 2 (sink): New > Azure SQL Database. Name it DS_SalesClean. Point it to the SalesClean table you created.
Step 3 — Build the Copy Activity pipeline:
- Go to Author > Pipelines > New Pipeline. Name it PL_SalesIngest.
- Drag a Copy Data activity onto the canvas. In the Source tab: select DS_SalesCSV. In the Sink tab: select DS_SalesClean. In the Mapping tab: drag each source column to its destination column. Run the pipeline using Debug — check the Monitor tab for row count.
Step 4 — Add a Mapping Data Flow for transformation:
- Add a Data Flow activity to the same pipeline, after the Copy activity. Create a new Data Flow called DF_SalesClean.
- Add a Source node pointing to DS_SalesCSV.
- Add a Filter node: expression is !isNull(SalesAmount) && !isNull(Region) — this drops rows with missing values.
- Add a Select node: rename ProductCategory to Category and SalesAmount to Revenue.
- Add a Derived Column node: add a new column Quarter with expression quarter(toDate(OrderDate)).
- Add a Sink node pointing to DS_SalesClean with ‘Truncate table’ enabled so each daily run starts clean.
Step 5 — Add a Schedule Trigger:
- Go to Manage > Triggers > New. Select Schedule. Set recurrence to daily, start time midnight UTC.
- The JSON for this trigger looks like:
{"type": "ScheduleTrigger",
"recurrence": {
"frequency": "Day",
"interval": 1,
"startTime": "2026-01-01T00:00:00Z"
}
}
Step 6 — Monitor and handle failures:
- Go to Monitor > Pipeline Runs. You’ll see run status, duration, and row counts. Click any run for activity-level detail.
- Add failure notification: create an Azure Logic App with an HTTP trigger. In ADF, add a Web Activity connected to the pipeline’s failure path. Configure it to POST to your Logic App’s URL. The Logic App sends you an email when the pipeline fails.
Total estimated cost for this full tutorial on a free Azure account: under ₹20 (approximately $0.22) in Data Flow compute. The Copy Activity itself is free for the first 100,000 runs per month.
3. ADF vs SSIS — The Comparison SQL Server Analysts Need
If you’ve worked in SQL Server environments, SSIS was your ETL tool. The question every analyst asks when moving to Azure is: do I need to relearn everything? The short answer is no. The mental model is the same packages become pipelines, tasks become activities, connections become linked services. What changes is scale, cost model, and where the compute lives.
| Dimension | Azure Data Factory | SSIS |
| Deployment | Cloud no server to manage | On-premises SQL Server install |
| Interface | Drag-and-drop browser UI | Visual Studio designer |
| Scaling | Petabyte-scale, auto-scales | Moderate, manually scaled |
| Pricing | Pay-per-activity-run | SQL Server license required |
| Data sources | 300+ cloud and hybrid connectors | Primarily on-premises SQL sources |
| Best for | Cloud-first, hybrid, new projects | Legacy on-prem SQL Server environments |
| Migration path | ADF can run SSIS packages via SSIS IR | Migrate to ADF or keep for existing packages |
One important detail: ADF can actually run existing SSIS packages without rewriting them. You deploy an SSIS Integration Runtime inside ADF, point it at your existing package store, and execute them as activities inside an ADF pipeline. This means organizations can migrate to ADF incrementally running new workloads in ADF while existing SSIS packages continue running unchanged inside the same orchestration layer.
For new analysts with no SSIS background: don’t learn SSIS. Start with ADF and you’ll be building skills that are current and directly transferable to Fabric Data Factory.
4. ADF in Microsoft Fabric — What Changes in 2026
Microsoft Fabric incorporates Data Factory as a native workload under the name ‘Data Factory in Fabric’. The interface lives inside your Fabric Workspace rather than a standalone Azure resource. The underlying concepts pipelines, activities, linked services, triggers are the same. What’s different is where you work and what you can connect to.
What changes in Fabric Data Factory:
- Dataflows Gen2 – the updated equivalent of ADF Mapping Data Flows. More destination options, tighter OneLake integration, and a redesigned Power Query editor. The transformation logic you learn in ADF Data Flows carries across directly.
- Data Pipelines – the orchestration equivalent of ADF pipelines. Same Copy activity, same trigger types, same monitoring. The JSON pipeline definition format is compatible.
- Workspace integration – your pipelines live in the same Fabric Workspace as your Lakehouse, Warehouse, and Power BI reports. No switching between portals.
What stays identical:
- The concept of a pipeline as a container for sequenced activities
- Linked Services and the credential management approach
- Schedule, Event, and Tumbling Window trigger logic
- Monitor tab layout and pipeline run diagnostics
Recommendation: learn ADF first. The hands-on project in this article is directly applicable. When you encounter Fabric Data Factory in a job or a new project, the learning curve is a surface update not a rebuild.
5. Portfolio Project — End-to-End Sales ETL Pipeline
This project uses publicly available data and produces a genuinely complete piece of work: raw CSV in cloud storage to a finished Power BI dashboard, fully automated. It’s the most common ADF architecture pattern in enterprise environments and the one interviewers reference most often.
Architecture:
- Source: Adventure Works Sales CSV stored in Azure Blob Storage (raw-data container)
- Pipeline: ADF Copy Activity + Mapping Data Flow (filter nulls, transform columns, add Quarter derived column)
- Destination: Azure SQL Database (Sales Clean table)
- Reporting: Power BI Direct Query connected to Azure SQL Database bar chart (Revenue by Category), map (Revenue by Region), line chart (Revenue by Quarter)
What to document in your GitHub README:
- Business problem: sales data arrives daily from multiple regional teams in inconsistent CSV formats. The pipeline standardises and loads it for analyst reporting.
- Architecture diagram: draw a simple flow (CSV → ADF → SQL → Power BI) using draw.io or Excalidraw and screenshot it into the README.
- Transformation logic: explain why you filtered nulls, what the Quarter column adds, and why you chose DirectQuery over Import mode in Power BI.
- Pipeline failure handling: describe the Logic App email notification and what you would do differently at scale (Azure Monitor alerts, retry policies).
Interview talking points this project generates:
- What is a Linked Service and how do you secure credentials in ADF?
Answer: Linked Services store connection strings; credentials are secured using Azure Key Vault references, never hardcoded.
- How did you handle pipeline failures?
Answer: Web Activity on the failure path triggers a Logic App HTTP webhook that sends email notification. Production setup would add retry policy (3 retries, 30-second interval) on the Copy Activity.
- Why did you choose a Schedule Trigger over an Event Trigger?
Answer: the source file arrives at a known time. Event Trigger would be better if file arrival time is variable.
6. ADF for Data Analyst Jobs in India — What Employers Are Hiring For
ADF appears in the majority of Azure data engineering and cloud analytics job postings on Naukri.com and LinkedIn India. It’s listed alongside T-SQL, Power BI, Azure Synapse, and increasingly Microsoft Fabric rarely as a standalone requirement, always as part of a broader Azure data stack.
Common job titles that require ADF:
- Azure Data Engineer the primary role. ADF is the core skill.
- Azure Data Analyst increasingly listed alongside Power BI and Synapse.
- Cloud BI Developer ADF for data movement, Power BI for reporting.
- ETL Developer (Azure) ADF replaces SSIS for cloud-first organisations.
Salary ranges (2026 estimates, India market):
- Fresher / 0–2 years experience: ₹5–9 LPA
- Mid-level / 3–6 years experience: ₹12–22 LPA
- Senior / 7+ years experience: ₹25–45 LPA
Top companies hiring for ADF skills in India:
- TCS, Infosys, HCL, Wipro, Cognizant client implementation and managed services
- Accenture, PwC India, Deloitte India consulting and enterprise migrations
- Product companies and startups increasingly using Azure-native stacks alongside these
Wrapping Up
Azure Data Factory is the connective tissue of every serious Azure data architecture. Synapse holds your data. Power BI shows it. ADF moves it reliably, automatically, and at whatever scale the business needs. Getting comfortable with it changes the kind of work you can do and the kind of roles you can apply for.
What this guide covered:
- Seven core ADF concepts Pipeline, Activity, Dataset, Linked Service, Integration Runtime, Trigger, and Mapping Data Flow — mapped to plain-English analogies
- A full eight-step ETL pipeline build: Blob Storage CSV to Azure SQL Database, with transformation, scheduling, and failure handling
- The trigger JSON configuration and column mapping approach for the Copy Activity
- ADF vs SSIS comparison across six dimensions with the migration path for SQL Server analysts
- What changes and what stays the same when ADF skills transfer to Microsoft Fabric Data Factory
- A complete portfolio project architecture with GitHub documentation guidance and interview talking points
- India job market context: titles, salary ranges, and top hiring companies
Build the pipeline. Document the project. The next step is Azure Databricks the Spark-based processing engine that ADF orchestrates for large-scale transformation workloads where Mapping Data Flows reach their limit.
Read Also:
Azure Synapse Analytics Tutorial for Data Analysts Complete 2026 Guide
50 SQL Interview Questions for Data Analysts With Answers
Job Notification Join us on Telegram: Click here
Job Notification Join us on WhatsApp: Click here