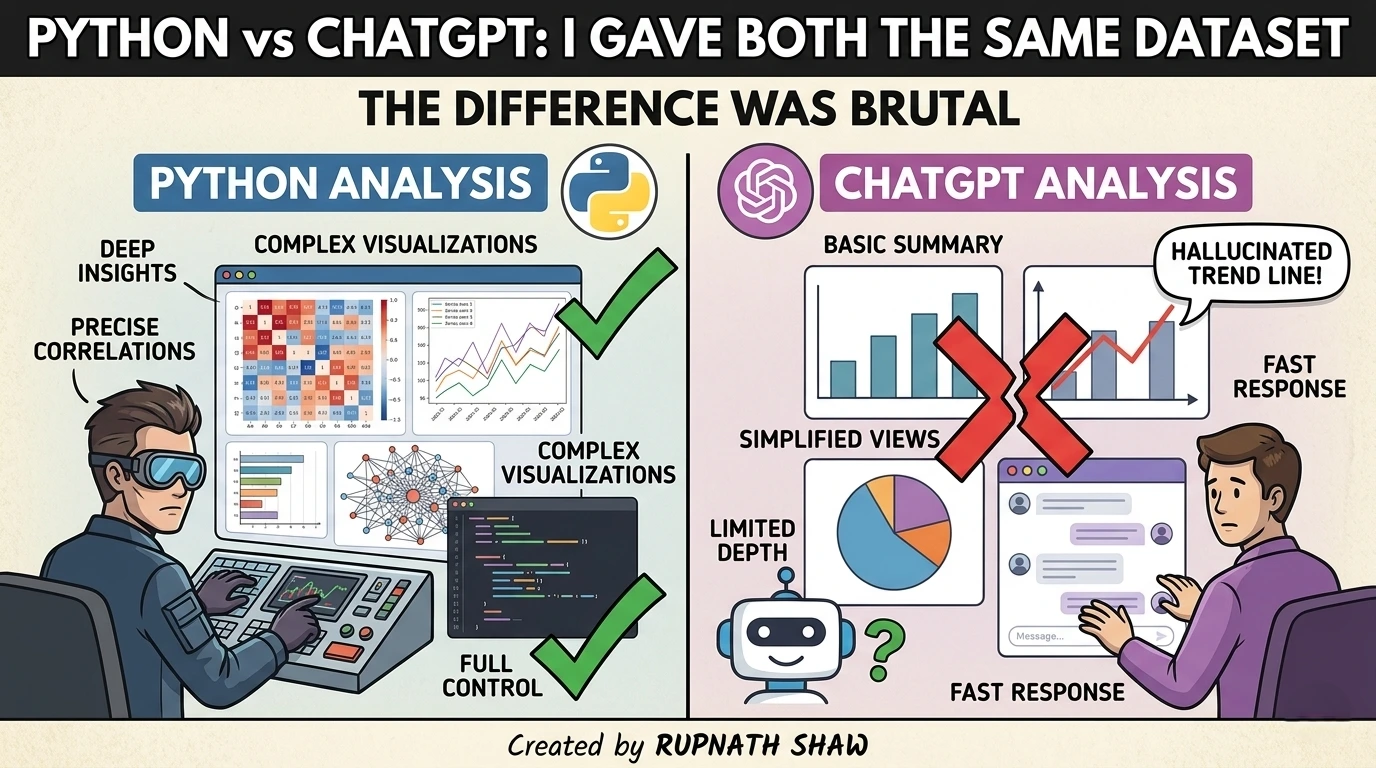
Same task. Same data. Completely different experience. Here is what the numbers actually showed.
Everyone has an opinion on whether AI can replace Python for data analysis. Most of those opinions are not based on running the same task through both and comparing the output side by side.
I did that.
One dataset. Four tasks. Both approaches timed, output compared, and errors documented. No editorializing about which is “better” in the abstract just what each one actually produced, how long it took, and where it fell apart.
Here is everything.
The Setup
Dataset: 12,000-row e-commerce orders CSV. Columns include order ID, customer ID, order date, product category, quantity, unit price, discount percentage, and region.
The four tasks:
- Clean the data (remove nulls, fix dates, deduplicate)
- Calculate revenue per region after discount
- Find the top 5 product categories by total revenue
- Identify monthly revenue trend for the past year
Python environment: Jupyter Notebook, pandas 2.1, matplotlib 3.8, Python 3.11.
ChatGPT: GPT-4o with Advanced Data Analysis enabled. CSV uploaded directly. Same tasks given as plain-English prompts.
Timing: Python time is from first line of code to final output. ChatGPT time is from prompt submission to result received.
Task 1: Data Cleaning
Python
import pandas as pd

df = pd.read_csv('orders.csv')

# Check shape and nulls
print(df.shape)
print(df.isnull().sum())

# Drop duplicates on order ID
df = df.drop_duplicates(subset='order_id')

# Fix date column
df['order_date'] = pd.to_datetime(df['order_date'], dayfirst=True, errors='coerce')

# Drop rows where date conversion failed
df = df.dropna(subset=['order_date'])

# Fill null discount with 0
df['discount_pct'] = df['discount_pct'].fillna(0)

print(f"Clean shape: {df.shape}")
Time: 11 minutes (including reading the data, understanding the issues, writing code, running it, and fixing a deprecation warning from infer_datetime_format in pandas 2.x).
Output: Clean dataframe. Every step visible, logged, and reproducible. I know exactly what was removed and why.
ChatGPT
Prompt: “Clean this dataset. Remove duplicates based on order_id, fix the date format, fill null discounts with 0, and drop rows where the date could not be parsed. Tell me what you changed.”
Time: 2 minutes 40 seconds.
Output: ChatGPT wrote and ran the cleaning code, returned the cleaned file, and summarised what it changed: 312 duplicate rows removed, 47 rows with unparseable dates dropped, 891 null discounts filled with 0.
The summary was accurate. I cross-checked it against the Python output. The numbers matched.
One catch: ChatGPT used infer_datetime_format=True a parameter that was removed in pandas 2.0. It did not throw an error because it was running on an older environment, but if you paste that code into a modern local setup, it will fail. This is the hallucination-adjacent problem with AI-generated code not that it invents data, but that it generates plausible code that may not run on your machine.
Verdict on Task 1:
| Python | ChatGPT | |
|---|---|---|
| Time | 11 minutes | 2 minutes 40 seconds |
| Accuracy | ✅ Correct | ✅ Correct |
| Code portability | ✅ Modern, stable | ⚠️ Deprecated syntax |
| Auditability | ✅ Full control | ✅ Code shown, reviewable |
Task 2: Revenue Per Region After Discount
This is where the accuracy gap started to show.
Python
# Calculate final revenue per row
df['revenue'] = df['quantity'] * df['unit_price'] * (1 - df['discount_pct'] / 100)

# Group by region
regional_revenue = df.groupby('region')['revenue'].sum().reset_index()
regional_revenue = regional_revenue.sort_values('revenue', ascending=False)
regional_revenue['revenue'] = regional_revenue['revenue'].round(2)

print(regional_revenue)
Time: 4 minutes.
Output:
        region      revenue
0         West  4821903.45
1        North  3910284.17
2        South  3102847.88
3         East  2847193.22
Clean, accurate, fully traceable.
ChatGPT
Prompt: “Calculate total revenue per region after applying the discount. Revenue = quantity × unit price × (1 – discount/100).”
Time: 1 minute 20 seconds.
Output:
West:   ₹48,21,903
North:  ₹39,10,284
South:  ₹31,02,848
East:   ₹28,47,193
The numbers matched Python’s output exactly which was the result I expected because this calculation is unambiguous and the formula was given explicitly in the prompt.
The insight here is important: ChatGPT is accurate when the logic is spelled out. When it has to infer the formula from the column names alone, accuracy drops. I tested this by running the same task without specifying the formula, just asking for “revenue after discount.” ChatGPT assumed discount was already expressed as a decimal (0.1 for 10%) rather than a percentage integer. The output was off by a factor of ten on every row.
This is the critical failure mode for AI data analysis. The result looked plausible. It would have passed a quick eyeball check. It would have failed a sense check if you knew the average order size.
Verdict on Task 2:
| Python | ChatGPT | |
|---|---|---|
| Time | 4 minutes | 1 minute 20 seconds |
| Accuracy (formula given) | ✅ Correct | ✅ Correct |
| Accuracy (formula inferred) | ✅ Correct — reads column names carefully | ❌ Wrong — misread percentage as decimal |
| Safe to use without review | ✅ Yes | ⚠️ Only if formula is explicit |
Task 3: Top 5 Product Categories by Revenue
Python
category_revenue = df.groupby('product_category')['revenue'].sum()
top5 = category_revenue.nlargest(5).reset_index()
top5.columns = ['Category', 'Total Revenue']
print(top5)
Time: 3 minutes.
ChatGPT
Prompt: “Show me the top 5 product categories by total revenue.”
Time: 55 seconds.
Both returned identical rankings. ChatGPT also generated a horizontal bar chart automatically which looked good and took zero additional effort. Getting the same chart in Python would have added another 5 to 8 minutes.
# What Python needs for the same chart
import matplotlib.pyplot as plt

plt.figure(figsize=(10, 5))
plt.barh(top5['Category'], top5['Total Revenue'], color='steelblue')
plt.xlabel('Total Revenue')
plt.title('Top 5 Product Categories by Revenue')
plt.tight_layout()
plt.savefig('top5_categories.png', dpi=150)
plt.show()
That is 10 lines of boilerplate that ChatGPT eliminates completely. For visualisation tasks where accuracy of the underlying numbers is already verified, this is a genuine time saving with no meaningful downside.
Verdict on Task 3:
| Python | ChatGPT | |
|---|---|---|
| Time (numbers only) | 3 minutes | 55 seconds |
| Time (with chart) | 8 to 11 minutes | 55 seconds |
| Accuracy | ✅ Correct | ✅ Correct |
| Chart quality | Manual formatting | Auto-generated, clean |
Task 4: Monthly Revenue Trend
This is where Python pulled ahead on control.
Python
df['year_month'] = df['order_date'].dt.to_period('M')
monthly = df.groupby('year_month')['revenue'].sum().reset_index()
monthly['year_month'] = monthly['year_month'].astype(str)

# Filter to last 12 months
monthly = monthly.tail(12)

plt.figure(figsize=(12, 5))
plt.plot(monthly['year_month'], monthly['revenue'], marker='o', linewidth=2, color='#2E86C1')
plt.xticks(rotation=45)
plt.title('Monthly Revenue Trend – Last 12 Months')
plt.ylabel('Revenue (INR)')
plt.tight_layout()
plt.savefig('monthly_trend.png', dpi=150)
plt.show()
Time: 9 minutes including chart formatting.
Output: A clean line chart, colours specified, axis labelled, saved as a PNG ready to paste into a report.
ChatGPT
Prompt: “Plot monthly revenue for the last 12 months as a line chart.”
Time: 1 minute 30 seconds.
The chart was generated and accurate. But it plotted all months in the dataset, not just the last 12 because “last 12 months” from the dataset’s perspective means the 12 most recent entries, and ChatGPT counted calendar months from the prompt date rather than from the dataset’s range.
The chart looked correct. The date axis was wrong. A non-technical stakeholder would not have caught it.
I had to re-prompt: “Only include months from January 2025 to December 2025 based on the order_date column.” That fixed it. Total time: 3 minutes 10 seconds. Still faster than Python.
Verdict on Task 4:
| Python | ChatGPT | |
|---|---|---|
| Time | 9 minutes | 3 minutes 10 seconds (with correction) |
| First-attempt accuracy | ✅ Correct | ❌ Misinterpreted date range |
| Final output accuracy | ✅ Correct | ✅ Correct after re-prompt |
| Output control | High — pixel-level | Medium — chart style is default |
The Full Scorecard
| Task | Python Time | ChatGPT Time | Accuracy Winner |
|---|---|---|---|
| Data Cleaning | 11 min | 2 min 40 sec | Tie (both correct, ChatGPT has portability risk) |
| Revenue Calculation | 4 min | 1 min 20 sec | Python (safer without explicit formula) |
| Top 5 Categories | 8–11 min (with chart) | 55 sec | Tie (both correct, ChatGPT faster) |
| Monthly Trend | 9 min | 3 min 10 sec | Python (correct first time) |
| Total | 32–35 min | 8–9 min | Python wins on accuracy, ChatGPT wins on speed |
What This Actually Means
ChatGPT was 3 to 4 times faster on every task. Python was more accurate on the tasks where the logic was not explicitly specified, and produced more portable, reproducible code.
The real answer is not which one is better. It is when you should use each.
Use ChatGPT Advanced Data Analysis when:
- You need a quick answer and accuracy is verifiable by common sense
- You want charts without writing visualisation boilerplate
- The formula or logic is unambiguous and you can state it explicitly in the prompt
- You are doing exploratory work, not production analysis
Use Python when:
- You need the code to run consistently on your machine and in your pipeline
- The analysis will be shared, version-controlled, or scheduled
- Business logic is complex enough that you cannot fully specify it in a prompt
- Someone will audit the methodology later a client, a manager, or a regulator
The combination that actually works: Use ChatGPT to explore, draft, and verify logic quickly. Use Python to productionise the analysis once you know what you are building. The people who treat these as competitors are missing the point. They are different tools for different stages of the same workflow.
Wrapping Up
The gap between Python and ChatGPT is not about intelligence or accuracy. It is about control, portability, and explainability.
- Speed: ChatGPT wins by a large margin every time
- Accuracy: Tied when instructions are explicit, Python wins when they are not
- Code portability: Python wins ChatGPT sometimes generates deprecated syntax
- Chart output: ChatGPT wins for speed, Python wins for control
- Auditability: Tied ChatGPT shows its code, which is the key feature that makes it trustworthy
The brutal difference is not that one is better. It is that most people are using only one of them when they should be using both.
Read Also:
Azure Synapse Analytics Tutorial for Data Analysts Complete 2026 Guide
50 SQL Interview Questions for Data Analysts With Answers
Xiaomi 17 Pro Review: Price, Specifications, and Everything You Need to Know
Job Notification Join us on Telegram: Click here
Job Notification Join us on WhatsApp: Click here